November 2026
Liability reduction occurs through closure work. There are two main mechanisms in Alberta to reduce industry liability: the Inventory Reduction Program (IRP) and the Orphan Well Association (OWA).
To ensure that the OWA has an operating budget, the AER issues an annual orphan fund levy to licensees. In 2025, the levy increased to $144.45 million. The levy is in part used for closure costs when an energy company is unable to meet its obligations to safely and responsibly close its infrastructure. For more information, see our Orphan Energy Sites webpage.
The IRP focuses on licensees reducing their liability by bringing sites to full closure and increasing the amount of land returned to equivalent capabilities. The program has two components: closure quotas and closure nomination.
Closure Quotas
The AER establishes an industry closure quota, which is the minimum amount of money that industry must spend on closure activities each year, to ensure that licensees are focusing on their closure obligations. The industry closure quota is then divided among licensees (their licensee quota). When closure work (decommissioning, environmental site assessment, remediation, and reclamation) is completed, industry reports the costs to the AER. This information is used to assess whether licensees meet their licensee quota, assess compliance actions (if necessary), and support updates to Directive 011 cost parameters. In 2025 the industry closure quota was set at $750 million.
In August 2025, the AER introduced a banked spend pilot that allows eligible licensees to carry forward closure spend that exceeds their licensee quota by more than 20% for use in future quota years. The pilot took effect beginning with the 2025 closure quota year. As of April 7, 2026, 122 licensees had accumulated approximately $286 million in banked spend. Licensees that received banked spend are identified in the downloadable Excel file, Company Compliance and Closure Spend Information.
For more information, see Directive 088 and Manual 023.
Before the introduction of closure quotas, the AER collected industry closure spend data through the voluntary area-based closure (ABC) program (2019 to 2021). See below for links to the previous highlight reports.
Closure Nomination
Closure nomination is part of the Inventory Reduction Program and enables eligible requesters to nominate inactive and abandoned oil and gas sites for closure. To be eligible, a well or facility must have been inactive or decommissioned for at least five years.
Closure nomination was implemented in 2023. In April 2026, Directive 088 introduced updated closure nomination requirements. All sites in the program were reassessed against the updated requirements and assigned closure plans with site-specific closure activities and timelines.
Closure plans may span several years, depending on the work required to achieve site closure and reclamation. As a result, closure spending varies across sites and reporting years. Reported spending demonstrates progress toward site closure and serves as a measurable indicator of work completed. To provide a complete picture of progress toward reclamation, spend is reported for all sites participating in the program.
Table 2. Closure nominated sites and reported spends, 2023–2025
| Year | Sites that meet current nomination criteria | Sites with spend/made progress | Total spent in year ($Millions) | Cumulative spent ($Millions) |
|---|---|---|---|---|
| 2023 | 1274* | 299 | $12.4 | $12.4 |
| 2024 | 48 | 321 | $15.4 | $27.8 |
| 2025 | 19 | 266 | $21.2 | $49.0 |
* Initially, 1332 sites were transferred from the Government of Alberta’s Site Rehabilitation Program (SRP), but after the 2026 reassessment of the program, 120 of those sites were removed due to not meeting the new criteria.
Closure Spend Summary, 2022–2025
The financial expenditure for the various closure activities is referred to as “closure spend.” This section focuses on the industry-funded OWA spend and the eligible closure spend (as defined in Manual 023) reported by industry for closure quotas.
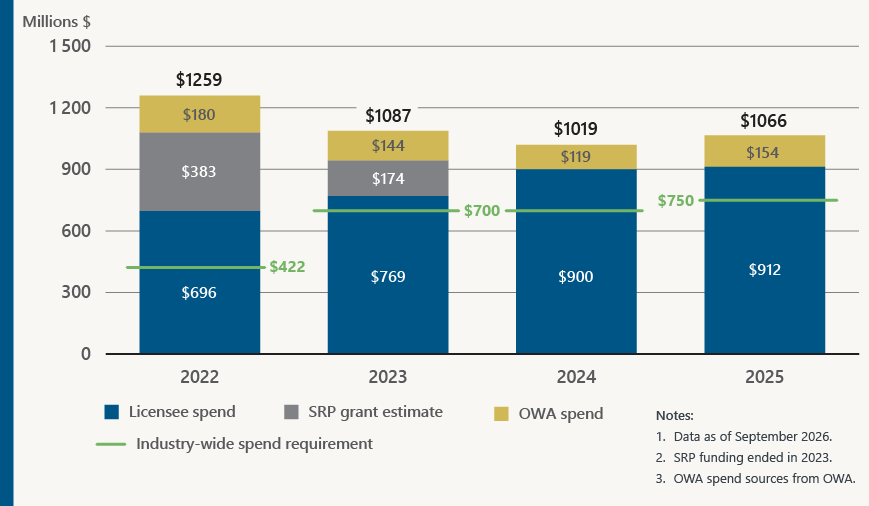
In 2025, the OWA completed $154 million in closure work. For more information, refer to the OWA annual reports, which summarize its fiscal-year performance.
Industry reported eligible spending of $912 million, exceeding the requirement by 22%. Figure 10 shows the cumulative closure spend from the OWA and industry. Licensee spend has increased each year, bringing the total licensee spending for 2025 to 2023 levels, which were supplemented by SRP.
In total, over $1 billion was spent on closure work in 2025.
Figure 10. Total closure spend and industry-wide spend requirements, 2022–2025
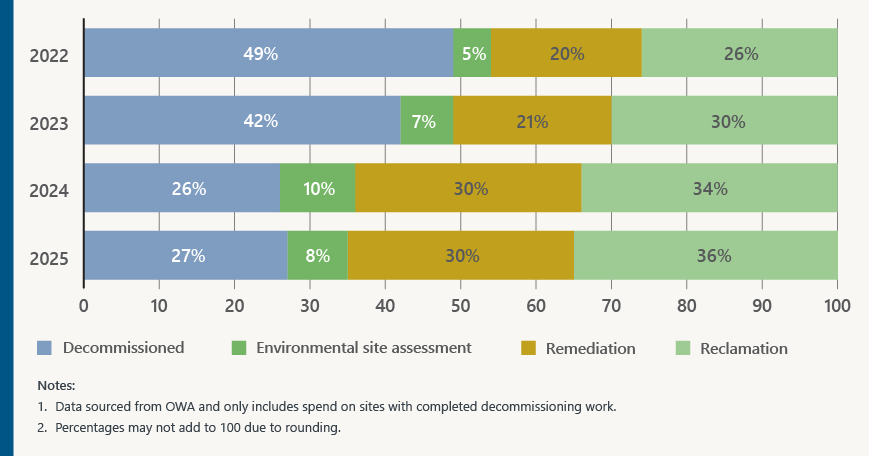
In 2025, the OWA continued to focus on remediation and reclamation, as shown in figure 11, with 66% of closure spend on remediation and reclamation activities.
Figure 11. Distribution of OWA spend by closure category, 2022–2025
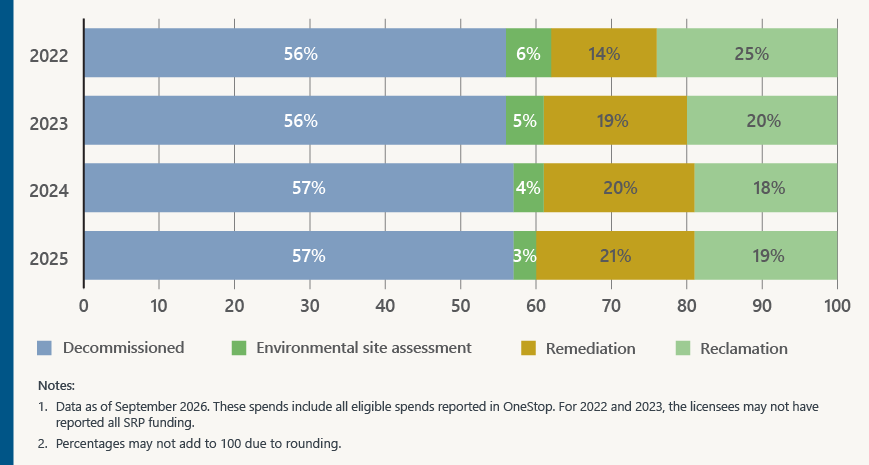
Licensees have consistently focused on closure decommissioning activities, as shown in figure 12, keeping about a 60/40 split between decommissioning and remediation/reclamation activities.
Figure 12. Distribution of industry spend by closure category, 2022–2025
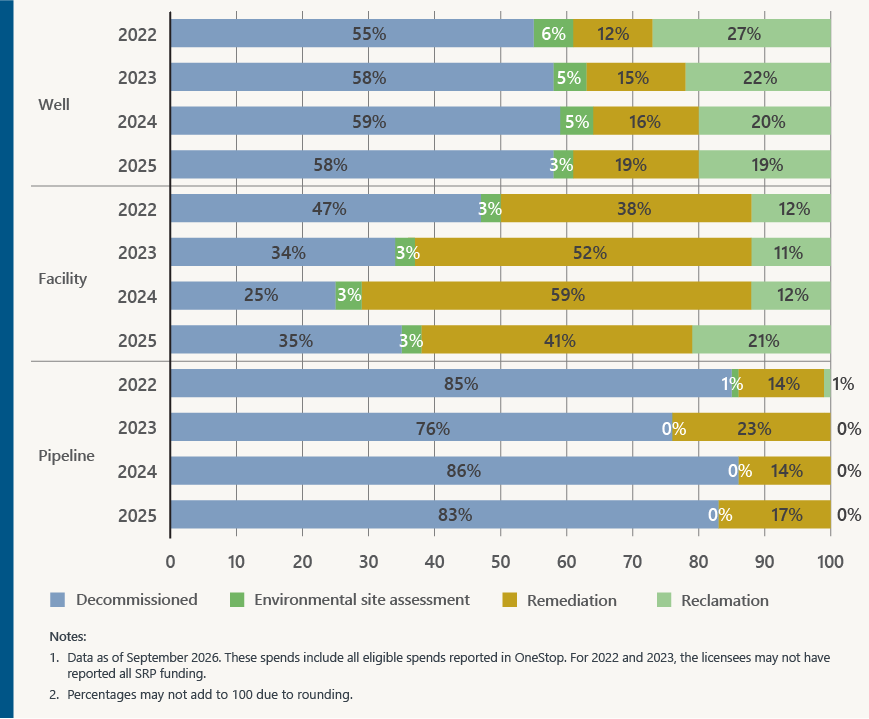
Evaluating licensee closure spend by infrastructure type, figure 13 shows that the breakdown of closure spend in 2025 was similar to 2024 for wells and pipelines, mostly on decommissioning with a slight increase in well remediation. For facilities, we have seen a decrease in remediation activity and more decommissioning and reclamation activities between 2024 and 2025.
Figure 13. Industry spend by infrastructure type by closure category, 2022–2025
Closure Activity Summary 2019–2025
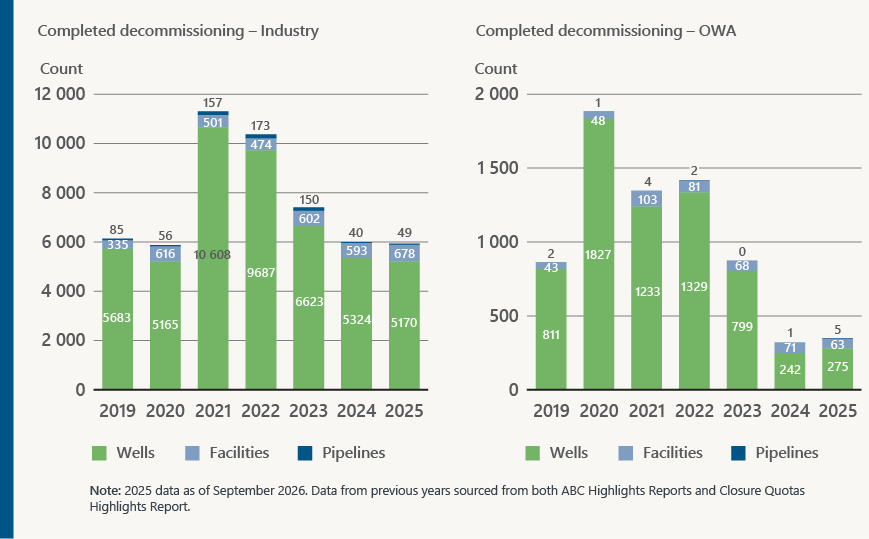
Figures 14 and 15 show the closure milestones achieved by industry and the OWA. Figure 14 highlights that between 2019 and 2021, closure work was primarily driven by the licensees participating in the voluntary ABC program, whereas activity since 2022 is related to closure quotas.
The increase in the completion of well decommissioning activities in 2021 and 2022 was likely due to funding from the SRP (2020 to 2023). There was a decrease in 2023 and plateauing in 2024 and 2025. Similarly, the OWA results in 2025 show the same trend with the completion of decommissioning activities.
Figure 14. Industry and OWA decommissioning, 2019–2025
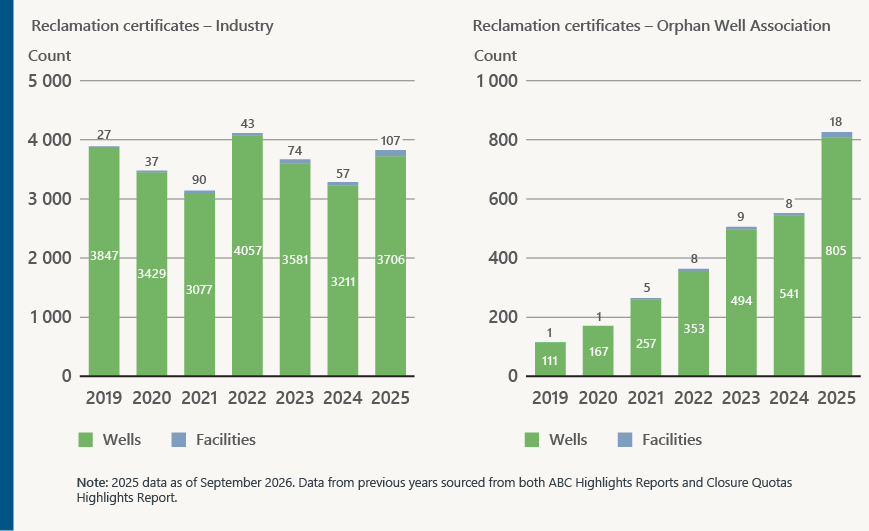
The number of licensees receiving a reclamation certificate increased in 2025 compared to 2024. The OWA also continued its steady growth in reclamation certification, building on progress made over the past five years (see figure 15).
Figure 15. Industry and OWA reclamation certification, 2019–2025