
November 2025
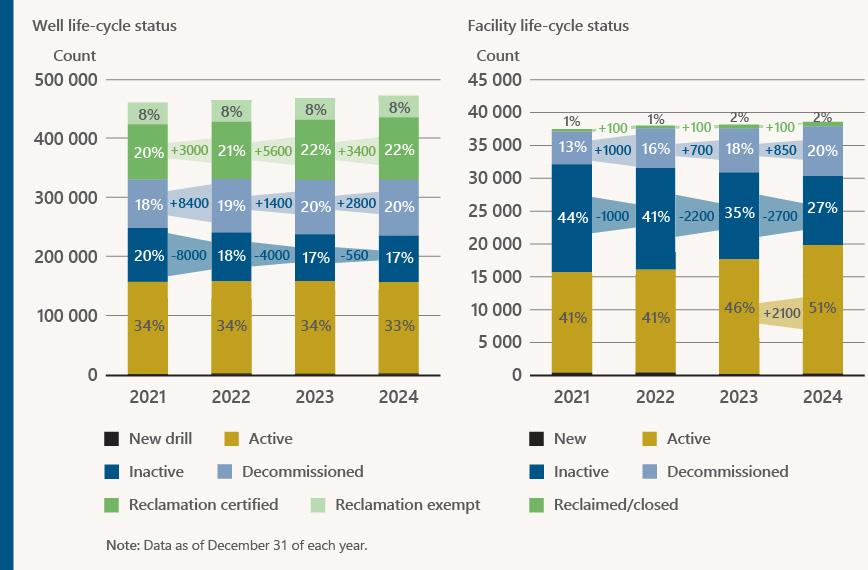
Well and facility life-cycle statuses change each year. New infrastructure is added, reactivated, and closure milestones are achieved by industry and the OWA (see figure 16). In 2024, the number of wells receiving reclamation certification continues to increase. The inactive well population decreased slightly because some infrastructure was decommissioned, some moved from active to inactive, and others were reactivated (inactive to active).
The facility life-cycle project has clarified the situation concerning facility licences. Licences for facilities that were never constructed were cancelled, resulting in fewer facilities in 2024 than in 2023, as well as data validation showing that more facilities were active than inactive.
Figure 16. Change in life-cycle status, 2021–2024
Total estimated liability changes every year. Liability is added each year with new activity, just as it is reduced through closure work. There is no one-to-one linkage between closure spend and the reduction of estimated liability. A $700 million quota does not mean a $700 million decrease in the estimated liability. This is because estimated liability only decreases once a closure milestone is achieved (e.g., after decommissioning work is complete and submitted or after a reclamation certificate is issued). Closure work is progressive, working towards a milestone, but milestones are not always achieved within a reporting year (e.g., to achieve a reclamation certificate, local vegetation sometimes takes several seasons to re-establish).
Table 2 breaks down the spend for closure work in progress and the spend for sites that achieved a closure milestone (i.e., decommissioned or reclaimed). Remediation and reclamation activities take longer to complete; therefore, most of this spend is on sites that have yet to reach a milestone and are still in progress.
As previously discussed, when a closure milestone is achieved, the estimated liability is reduced by the value from the most recent edition of Directive 011 or the SSLA, not the amount actually spent.
- Figure 14 shows that 6271 wells, facilities were decommissioned in 2024. Table 2 shows $308 million spent on decommissioning (closure milestone). However, this results in an estimated liability reduction of $354 million based on liability values in Directive 011 and the SSLAs.
- Figure 15 shows that 3817 wells and facilities were reclaimed. Table 2 shows $7.5 million spent on reclamation activities in 2024, However, this results in an estimated liability reduction of $99 million.
Table 2. Industry closure spend in progress and achieving a milestone, 2022–2024
| Year | Closure in progress Spend ($ millions) | Closure milestone Spend ($ millions) | ||||
|---|---|---|---|---|---|---|
| Decommissioning | Environmental site assessment | Remediation | Reclamation | Decommissioning | Reclamation certified | |
| 2022 | 161.1 | 62.4 | 144.2 | 251.8 | 419.2 | 5.0 |
| 2023 | 178.9 | 45.7 | 175.3 | 179.8 | 339.6 | 2.0 |
| 2024 | 209.1 | 38.9 | 178.8 | 157.8 | 308 | 7.5 |
Closure Spend Compliance
Each licensee with inactive liability has a mandatory closure spend requirement. Licensees that met the requirement spent equal to or more than their mandatory spend or provided security in lieu of closure work. Licensees that did not meet their mandatory spend were able to come into compliance by providing security for the difference between their mandatory closure spend requirement and their closure spend reported. Licensees that did not provide security are still noncompliant.
For the 2024 mandatory closure spend, 85% of licensees were compliant either through completing closure work or providing security. There are 69 noncompliant, active licensees with $6.4 million in outstanding quotas, which is less than 1% of the industry-wide closure spend requirement.
More information can be found on the interactive licensee dashboard where stakeholders can review individual licensee information.
Table 3 summarizes the amount still owing in security for 2022, 2023, and 2024.
Table 3: Outstanding closure quota compliance and security owing, 2022-2024
| Year | Outstanding Closure Security Owed ($ millions) |
|---|---|
| 2022 | 2.7 |
| 2023 | 4.2 |
| 2024 | 6.4 |
| Total security owed | 13.3 |
Note: Data as of October 2025. data continues to change as compliance activities are undertaken.
Licensee-specific compliance actions (i.e., limited eligibility, global refer status, issuance of an order) can be found on the AER Compliance Dashboard.
Table 4 lists the 22 active licensees who were noncompliant for 2022, 2023, and 2024 for closure spend quota.
Table 4: Licensees noncompliant with 2022, 2023 and 2024 mandatory spend
| Licensee name | Total security owed |
|---|---|
| 1099477 Alberta Ltd. | $2 855.00 |
| 935821 Alberta Ltd. | $24 788.06 |
| Altima Resources Ltd. | $113 639.80 |
| Ascensun Oil and Gas Ltd. | $599 941.39 |
| Bay Trail Resources Ltd. | $7 418.00 |
| Bluestone Resources Inc. | $37 896.00 |
| Crimson Oil & Gas Ltd. | $521 411.96 |
| Deccan Energy Ltd. | $93 321.21 |
| Jaycor Resources Inc. | $43 567.08 |
| Kasten Energy Inc. | $1 221 753.98 |
| Mooncor Energy Inc. | $64 817.02 |
| Mutiny Oil & Gas Ltd. | $134 197.36 |
| Pantera Silver Corp. | $2 855.00 |
| Petebrook Investments Ltd. | $5 709.00 |
| Regnum Energy Ltd. | $73 923.54 |
| Renergy Petroleum (Canada) Co., Ltd. | $905 693.34 |
| Ridgeway Petroleum Corp. | $5 882.00 |
| Seol Energy Inc. | $375 981.48 |
| Sunshine Oilsands Ltd. | $494 247.00 |
| Topeka Energy Inc. | $4 714.50 |
| Tri-Energy Resources Ltd. | $47 869.15 |
| True North Oil & Gas Limited | $4 714.50 |
See “Additional Information” on the Liability Management Performance Report webpage for the following:
- Interactive dashboards for licensee-specific information and regional-specific information. Only active licensees are included in this year’s report.
- A list of companies and their compliance with 2024 closure quotas. Only licensees with inactive liability from inactive or abandoned well or facility licences receive closure quotas.
Licensee compliance with the orphan fund levy can be found on the LM Reporting webpage.