November 2025
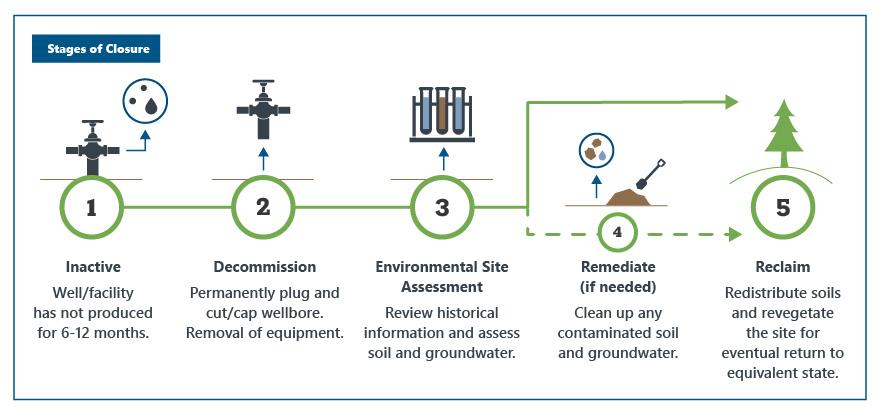
The energy industry has been a driver of Alberta’s economy for decades, resulting in various infrastructure on the landscape (wells, facilities, and pipelines). Figure 1 shows the various infrastructure life cycle (active, inactive, decommissioned, and reclaimed).
Ultimately, all infrastructure and energy development sites must be permanently and safely decommissioned, assessed, remediated if necessary, and reclaimed. These activities are known as “closure.” The obligation to carry out and pay for this work (known as “liability”) rests with industry.
Figure 1. Stages of Closure
Liability is associated with all energy infrastructure, regardless of its stage in the life cycle. However, close attention is paid to the amount of liability associated with inactive infrastructure as it no longer generates income for a licensee to pay closure costs.
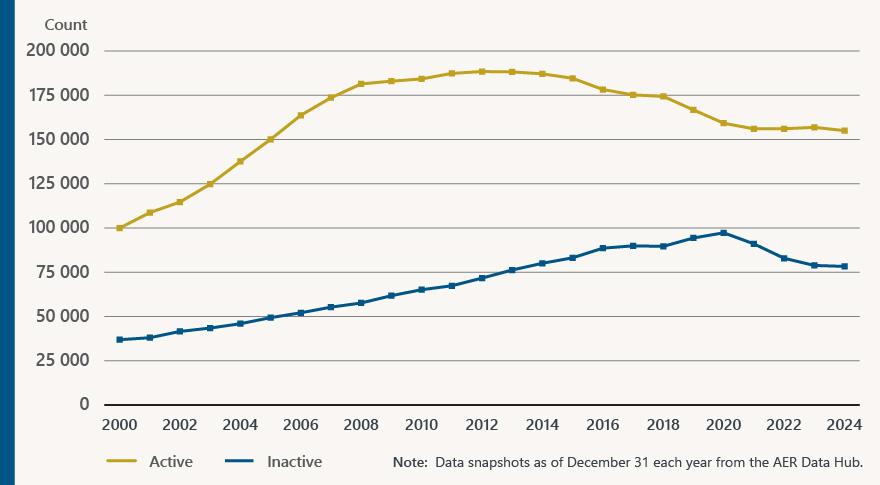
Figure 2 shows that the closure rate and drilling rate do not match. Consequently, inactive infrastructure within the province has increased 5% annually. If closure activities had been carried out at the same pace as energy development, the growth of inactive infrastructure may have been curtailed.
Since 2020, the inactive well trend has reversed and continues to trend downwards and may be levelling off (see figure 2). Although this is a positive trend, continued effort and focus by industry are essential to maintaining this downward trajectory.
Figure 2. Number of active and inactive wells, 2000–2024
In 2014, the AER introduced the Inactive Well Compliance Program (IWCP) to address the growing number of inactive wells that were noncompliant with Directive 013 suspension requirements. By the end of the program in 2021, approximately 37% of the wells brought into compliance were decommissioned, and 6% were reclaimed instead of being suspended. The remaining wells remained inactive.
With the introduction of the IWCP, licensees have prioritized decommissioning older wells rather than suspending them. In 2014, 55% of the wells decommissioned were older than 10 years, and only 20% were over 20 years old. In 2024, over 90% of the decommissioned wells were older than 10 years and 67% older than 20 years (see figure 3).
Figure 3. Decommissioned wells by production, 2000–2024
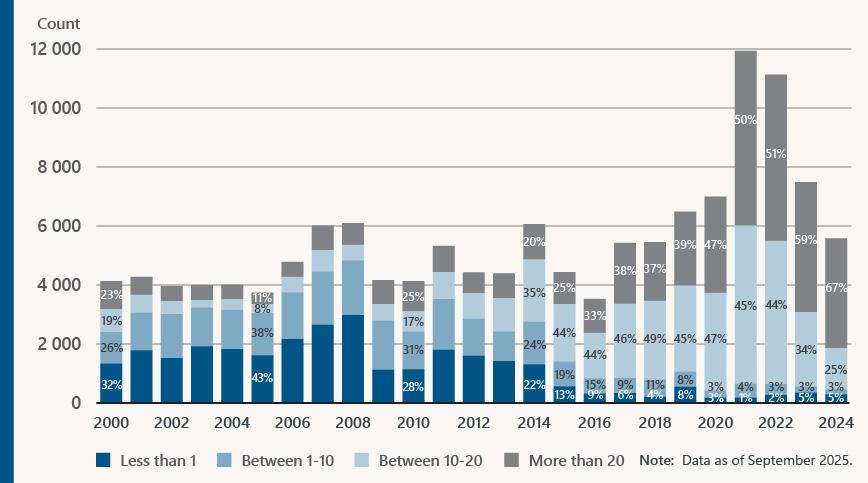
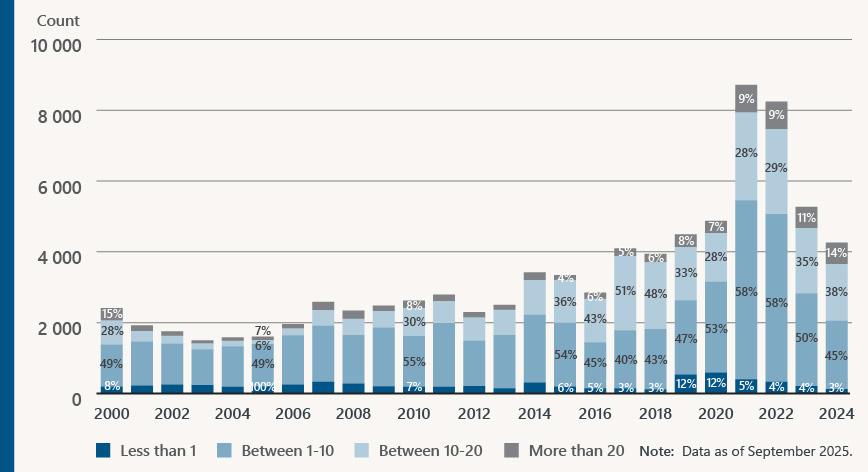
Figure 4 illustrates the duration that wells are inactive before decommissioning. The figure does not include active wells that have been decommissioned; therefore, the well count in figure 4 is lower than for figure 3. Historically, licensees focused on decommissioning recently inactive wells (less than 10 years inactive). Additional effort is required to prioritize the decommissioning of long-term inactive wells that are no longer economically viable and potentially more complex.
Figure 4. Decommissioned wells by years inactive, 2000-2024
Tracking well and facility life-cycle trends over time will help us monitor industry’s progress on closure obligations and liability management. Our goal is for industry to convert inactive inventory in a timely manner to being decommissioned and reclamation certified.
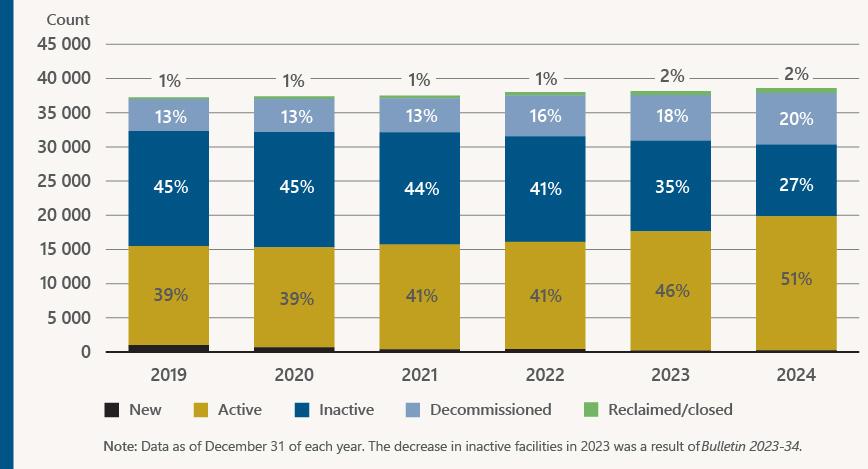
Figure 5 shows the life-cycle status of wells from 2000 to 2024, and figure 6 shows facilities from 2019 to 2024. Throughout 2023 and 2024, licensees provided information to validate their facility operational life-cycle status. Consequently, licensee data validation resulted in some of the facilities changing status from inactive to active. In 2024, any facility where the operational life-cycle status could not be verified was identified as inactive. (See Bulletin 2023-34 for more information on how we improved the quality of facility life-cycle status data.)
Figure 5. Number of wells by life-cycle status, 2000–2024
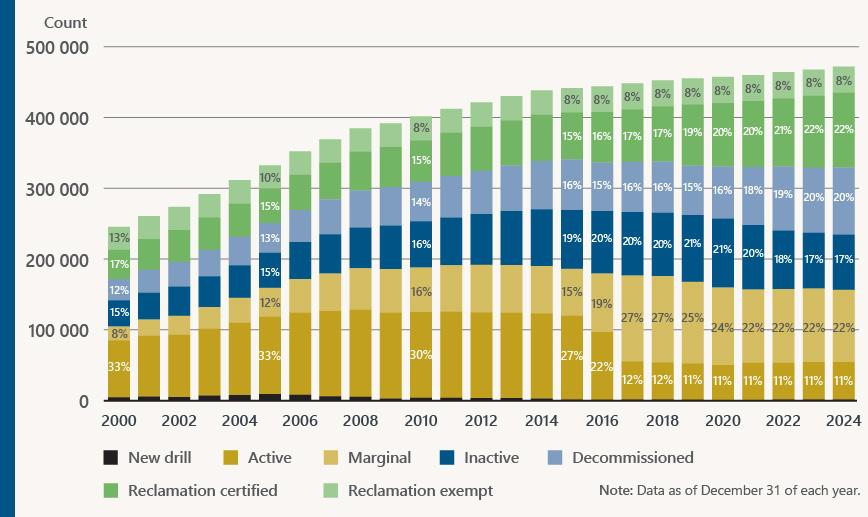
Figure 6. Number of facilities by life-cycle status, 2019–2024
For more information on the pipelines we regulate, see our pipelines topic on our website.
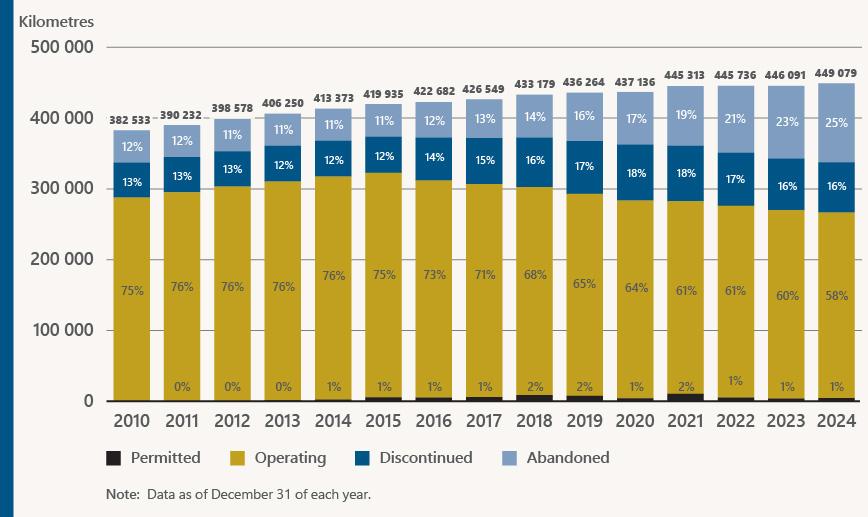
A pipeline licence is approved (“permitted” status) and then moves into operations (“operating” status). A pipeline status of “discontinued” corresponds to an inactive well. When the pipeline status is “abandoned,” it has met the criteria for abandonment. Licensees apply to change the pipeline licence status in accordance with the Pipeline Rules and Directive 065. The AER will then review the application and either approve or deny it based on relevant information. Figure 7 shows the total length of “operating” pipelines decreasing since 2016. In 2024, 58% of the pipeline length is “operating,” while 41% of the pipeline length is “discontinued” or “abandoned.”
Figure 7. Combined pipeline length in kilometres by licence status
.