Updated June 2025
The Alberta Energy Regulator (AER) provides for the safe, efficient, orderly, and environmentally responsible development of hydrocarbon, geothermal, and mineral resources over their entire life cycle. As part of our mandate, we provide our stakeholders with credible information about Alberta’s energy resources that can be used for decision making.
A key information resource is the Alberta Energy Outlook (ST98), an annual report with independent and comprehensive information on the state of hydrocarbon reserves and the supply and demand outlook for Alberta’s diverse energy resources (crude bitumen, crude oil, natural gas, natural gas liquids1, coal and emerging resources). The reserves data have been updated this year to reflect an external analysis and will be revised as new information becomes available. Additionally, this report discusses prices, capital expenditures in the oil and gas sector, pipelines, carbon capture, utilization, and storage (CCUS), and other infrastructure related to Alberta's energy resources.
Alberta's oil and gas industry has been a cornerstone of the province's economy and a significant contributor to provincial and federal government revenues since 1947. It is reported that the industry contributed about $280 billion in royalties to the provincial government from 1947 to 2023. Furthermore, the industry is a notable contributor to federal income through federal taxes, supporting vital national programs including the federal equalization program since its inception in 1957.
Data sets for executive summary are available in Excel format.
A PDF of the executive summary is also available.
Report Overview
In 2024, Alberta's oil industry experienced notable growth due to pipeline capacity improvements and favourable oil prices. Oil companies increased their production, seeking to use the newly operational Trans Mountain Pipeline Expansion (TMX), which came online in May 2024. Moreover, natural gas production increased slightly as liquid-rich gas production rose despite low natural gas prices. At the start of 2025, global energy markets exhibited high volatility due to heightened uncertainties, including U.S. trade policies and geopolitical tensions in Ukraine and the Middle East. These uncertainties influenced investment, trade, and economic growth, while reigniting concerns about energy affordability, reliability, and security.
Because of significant uncertainty, particularly regarding U.S. tariff policies, this year’s report examines two scenarios: a short-term tariff uncertainty scenario (base case) and a one-year tariff scenario (tariff case). The primary difference between these scenarios lies in their tariff assumptions.
- Base case: This scenario assumes business as usual and no tariffs. However, the U.S. tariff threats on energy products (oil and gas) persist throughout the first half of 2025 but are ultimately averted through diplomatic negotiations by midyear. Consequently, energy supply and demand are minimally affected.
- Tariff case: This scenario assumes a 10% U.S. tariff on energy products (oil and gas) and 25% tariffs on other Canadian goods imposed in the first half of 2025 despite diplomatic efforts. This scenario includes subsequent U.S. and Canadian retaliatory tariffs, other nontariff measures2, and additional U.S. tariffs on other trading partners. All tariffs and nontariff measures between Canada and the United States persist until the end of the first quarter of 2026 before mostly being phased out as the review and renegotiation of the Canada-United States-Mexico Agreement takes place. It is expected tariffs will have some long-term effects and structural changes to the global economy (changes in trade and investment flows).
These tariff assumptions affect prices, costs, commodity profitability, investment, supply and demand, project risk factors, and commercial start dates (where applicable) for most chapters of the report, including comparisons of the outcomes of these scenarios. These two scenarios provide a range of potential outcomes. If actual tariff conditions deviate from our assumptions, we anticipate the realized results could vary.
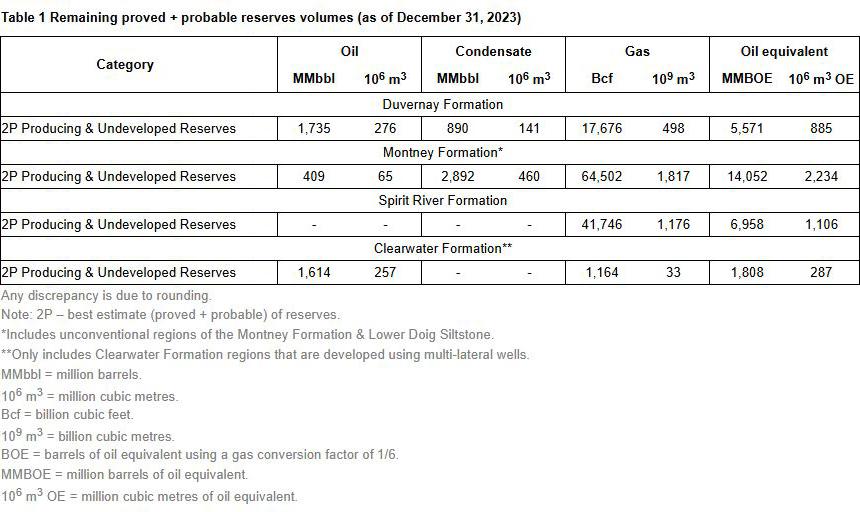
Reserves data for the province is being updated by McDaniel and Associates Consultants Ltd. and results are currently available for the Duvernay Formation, Montney Formation, Spirit River Formation, and the region of the Clearwater Formation being developed through multilateral well designs. The updated natural gas reserves for the Montney, Duvernay, and Spirit River Formations are significant not only for Alberta but also for Canada. Based on the Government of Alberta press release in March 2025, with new estimates for these formations, Canada has more than doubled its gas reserves, moving it from number 15 to number 9 globally in reserves.
Alberta maintains its dominant position with proved oilsands reserves, substantially surpassing Texas's oil reserves. Emerging opportunities like multilateral drilling in the Clearwater Formation will further bolster Alberta's strong position.
Oil prices experienced minor percentage changes compared with natural gas prices in 2024. The North American light oil benchmark price (West Texas Intermediate [WTI]) decreased by 2.4%, and the Alberta heavy-oil benchmark price (Western Canadian Select [WCS]) increased by 3.4%. Conversely, the North American natural gas price (Henry Hub) declined by 9.7%, and the Alberta local price (AECO-C) fell substantially by 47%.
The WTI price dropped to US$75.72 per barrel (bbl) in 2024. In early 2024, WTI price rose amid Middle East tensions and potential supply constraints. Later in the year, WTI price moved lower due to increased U.S. shale production and slowing economic growth in major economies, such as China and European countries. This decline was partly offset by delayed production increases from the Organization of the Petroleum Exporting Countries and its allies (OPEC+). Throughout 2024, WTI mostly remained within a relatively narrow trading range between US$65.00 and US$85.00/bbl. At the start of 2025, U.S. trade policies, geopolitical uncertainties, OPEC+ supply decisions, and recession fears weighed on oil prices. Considering these factors, we forecast a base case WTI price of US$66.00/bbl for 2025.
The price differential between WTI and WCS prices averaged US$14.73/bbl in 2024, roughly US$4/bbl lower than in 2023 due to the start-up of the TMX pipeline in 2024. Figure 1 shows the oil price history and price differential.
The Henry Hub price for natural gas decreased by 9.7% from the previous year to an average of US$2.41 per million British thermal units (MMBtu) in 2024, the second-lowest price in the last two decades. The mild winter, robust U.S. production, limited growth in natural gas consumption, and high inventories put downward pressure on prices. In early 2025, colder weather and elevated demand from new North American liquified natural gas (LNG) projects lifted the average Henry Hub price above US$4/MMBtu in February. With increased demand, the Henry Hub price is forecast to average US$3.80/MMBtu in 2025 under the base case.
The average AECO-C natural gas price was Cdn$1.45 per gigajoule (GJ) in 2024, representing a decrease of 47% from 2023. The natural gas price differential between Henry Hub and AECO-C widened in 2024 due to ample inventories in Alberta and reduced exports to the U.S.
Total oil production (including crude oil, oil sands, and pentanes plus) continued to rise as companies increased production and shipped oil using the newly operational TMX pipeline. The production increase mainly came from nonupgraded bitumen, followed by upgraded bitumen.
Despite lower prices in 2024, production of marketable natural gas increased marginally by 0.2%. While dry natural gas production experienced declines, this was offset by increased output from liquids-rich regions and elevated associated gas production from oil wells.
In 2024, total capital expenditures for crude oil, natural gas, oil sands, and emerging resources continued to grow, reaching Cdn$31 billion, a nine-year high. Crude oil and natural gas investment reached Cdn$16.8 billion. Oil sands investment increased to Cdn$13.3 billion due to continued focus on debottlenecking and improving operational efficiency across oil sands facilities.
Market access remained sufficient for oil and gas exports in 2024. Takeaway capacity was enhanced by the start-up of the TMX pipeline in May 2024. For natural gas transportation, capacity met the export demand, and transportation capability improved further after the completion of the Coastal GasLink pipeline in British Columbia, connecting to LNG Canada facilities.
Alberta presents growth opportunities for emerging resources: hydrogen, geothermal energy, helium, and lithium. Under the base case, hydrogen production is estimated to increase from 2.6 million tonnes in 2024 to 4.4 million tonnes in 2034. Despite the current low production levels, geothermal production is forecast to increase to 76.2 gigawatt-hour and helium to 10.4 thousand cubic metres per day (103 m3/d) by 2034 from 2024 levels. Although there is no commercial lithium production in Alberta in 2024, lithium production is forecast to reach 14.8 thousand tonnes per year by 2034. For emerging resources, production under the tariff case is lower than the base case. Hydrogen production is, on average, reduced by 4%, geothermal by 9%, and helium by 13% from the base case over the forecast period.
Alberta CCUS projects continue to demonstrate success in mitigating carbon emissions. In 2024, the Shell Quest project permanently sequestered 1.0 million tonnes of carbon dioxide and Enhance Energy’s Clive Field project, part of the Alberta Carbon Trunk Line, permanently sequestered 1.4 million tonnes of carbon dioxide.
Report Highlights
This section provides highlights of oil and gas production, prices, capital expenditures, demand, and drilling activity for 2024 and their outlook for 2025 to 2034 (the forecast period).
Oil and Gas Production in Canada
Alberta remains the largest natural gas and oil producer in Canada (see Figure 2 and Figure 3). In 2023, Alberta produced 61% of Canada’s natural gas, although British Columbia's share of marketable gas production has trended up from 27% in 2013 to 37% in 2023. Alberta accounted for 84% of Canada’s oil and equivalent3, and 66% was marketable bitumen in 2023.
In 2024, raw crude bitumen production in Alberta was close to 3.6 million barrels per day (106 bbl/d), a 4% increase from 2023.
Oil and Gas Prices
Figure 4 shows the WTI price history and forecast price ranges for the base case and tariff case.
- The price of WTI decreased by 2.4% in 2024, averaging US$75.72/bbl.
- The price of WCS increased by 3.4% in 2024, averaging US$60.99/bbl.
- Under the base case, the WTI price is projected to be lower in 2025 at US$66.00/bbl. Global liquid fuel demand growth is expected to slow down in 2025, with lower global economic activity due to trade policy uncertainty. The decision by OPEC+ to increase supply would further depress the WTI price.
- Under the tariff case, the WTI price is expected to decline to US$60.00/bbl in 2025 as tariffs weigh on international trade and global oil demand growth.
- The low-price case of US$44.50/bbl in 2025 considers global oil demand to contract due to a global economic recession, OPEC+ production exceeding their target output level, and stronger-than-expected non-OPEC+ production growth.
- The high-price case of US$92.50/bbl in 2025 considers diplomatic negotiations will quickly resolve trade tensions, global economic activity will rebound faster than projected, OPEC+ increases oil supply at a slower than expected pace, and deteriorating geopolitical tensions will further disrupt regional oil supply.
- The WTI crude oil price is forecast to rise to US$68.00/bbl in 2026, as oil demand growth is expected to rebound as tariff uncertainties are removed. The price is projected to increase moderately from 2027 onwards, reaching US$76.50 by 2034 (base case forecast).
- The differential between WTI and WCS narrowed in 2024 to an average of US$14.73/bbl compared with the 2023 average of US$18.65/bbl, reflecting the start-up of the TMX pipeline in May 2024, adding export capacity to the Canadian West Coast.
Figure 5 shows the Henry Hub price history and forecast price ranges.
- The Henry Hub price decreased by 9.7%, averaging US$2.41/MMBtu in 2024. Mild winter weather, robust U.S. production, limited natural gas consumption growth, and high inventories put downward pressure on prices.
- Under the base case, the Henry Hub price is expected to rise to an average of US$3.80/MMBtu in 2025, with colder weather and elevated demand from newly completed LNG projects. Despite the price increase, natural gas export capacity remains limited, and natural gas prices in North America are only partially dependent on international prices. North American regional factors are the primary drivers of the price forecast.
- Under the tariff case, the Henry Hub price is anticipated to be lower than the base case at around US$3.20/MMBtu in 2025. Lower North American gas demand under the tariff case due to slowing economic growth will depress the price.
- In the low-price case, the price is forecast to average US$1.86/MMBtu in 2025 because of lower-than-expected North American demand due to an economic slowdown and strong U.S. natural gas production growth.
- In the high-price case, the price is forecast to average US$6.53/MMBtu in 2025 because of a colder winter and a stronger-than-expected economic activity supporting North American demand.
- The Henry Hub price is forecast to rise to US$3.90/MMBtu in 2026 as U.S. demand growth rebounds; however, solid natural gas production growth will limit the price gains. The price is forecast to increase from 2027 onwards, reaching US$4.59/MMBtu by 2034 (base case forecast).
Capital Expenditures
Figure 6 shows the capital expenditure history and forecast for hydrocarbons and emerging resources.
- Total capital expenditures in the crude oil, natural gas, oil sands, and emerging resources sectors increased by 2.2% in 2024, rising to Cdn$30.9 billion.4 Reasonably high oil prices, alongside improved market access from the TMX pipeline, supported the expenditure growth.
- Estimated crude oil and natural gas capital expenditures remained steady in 2024 at Cdn$16.8 billion. Expenditures were sustained by sufficiently high oil prices and increased oil drilling activity.
- With the completion of the TMX pipeline in 2024 and continued debottlenecking, alongside improved operational efficiency across oil sands facilities, estimated oil sands capital expenditures grew by 6.4% from Cdn$12.5 billion in 2023 to Cdn$13.3 billion in 2024.
- Total capital expenditures in the crude oil, natural gas, oil sands, and emerging resources sectors will reach Cdn$41.5 billion in 2034 in the base case and Cdn$40.1 billion in the tariff case.
- Total oil sands, crude oil, and natural gas capital expenditures are estimated to be Cdn$30.1 billion in 2024. In the base case, investment is projected to grow steadily at an average of 3% over the forecast period. By the end of the forecast period, total capital expenditures are expected to remain relatively low compared with the 2014 peak level.
- Capital spending for emerging resources was an estimated Cdn$0.79 billion in 2024 and is projected to increase to Cdn$1.2 billion by 2034 in the base case, with some uncertainty. This spending is risked and projected based on public announcements for hydrogen, helium, lithium, and geothermal projects and estimated capacity additions.
Reserves
The AER has been providing an independent appraisal of Alberta’s energy resources since 1961. The AER studies hydrocarbon extraction and ensures energy resources are being extracted in an efficient and environmentally responsible manner.
The Government of Alberta uses the information to develop policies and regional land use plans, and the energy industry uses it to evaluate investment opportunities in Alberta.
In 2024, the AER procured the services of McDaniel and Associates Consultants Ltd. (McDaniel) to evaluate the reserves and resources of Alberta using industry-accepted methods published in the Canadian Oil and Gas Evaluation Handbook for conventional, unconventional and oil sands formations. Results for the Montney, Duvernay, and Spirit River Formations and the heavy-oil regions of the Clearwater Formation through multilateral well designs are currently available, and the Alberta Energy Outlook will be updated as more results are delivered in 2025.
Table 1 shows the oil and gas unconventional reserves for four formations: Montney, Duvernay, Spirit River, and the heavy-oil regions of the Clearwater. The data suggests Alberta has sufficient reserves for many years of production.
Production and Demand
Figure 7 shows the primary energy production in Alberta by type in the base case and the total primary energy production in the tariff case.
- Total primary energy produced in Alberta increased by 3% in 2024 5 as crude oil and oil sands producers increased production and took advantage of increased pipeline takeaway capacity from the TMX pipeline and favourable oil prices. Natural gas producers continued to focus on drilling in liquid-rich areas with reasonably high prices for liquids.
- Marketable bitumen production, which includes nonupgraded and upgraded bitumen, increased by 4% in 2024, led by optimizations and investment to existing sites, which drove efficiencies and improved productivity, leading to record production from nearly all mines and some in situ projects.
- Crude oil production increased by 3% in 2024 as producers took advantage of relatively high oil prices despite inflation driving up capital and operating costs of production.
- Total marketable natural gas production increased marginally in 2024. Production of shale gas and gas from oil wells increased, while conventional and coalbed methane production remained comparable to 2023. The higher production was driven by increases in production concentrated in the Foothills Front and Northwestern Alberta areas.
- In 2024, Alberta produced an estimated 15 470 petajoules (PJ) of energy from all sources or 6.9 million barrels per day of light-medium quality crude oil equivalent (106 BOE/d).
- Under the base case, Alberta is projected to produce 16 969 (7.6 106 BOE/d) of energy from all sources in 2034. Under the tariff case, Alberta is projected to produce 16 723 PJ (7.5 106 BOE/d) of energy from all sources in 2034, 2% lower than the base case.
- Upgraded and nonupgraded bitumen production accounted for 52% of total primary energy production in 2024.
- In 2024, based on energy content, natural gas liquids production was about 40% higher than crude oil production. This trend is expected to grow over the forecast period in the base case.
- Total natural gas liquids production increased by 6% in 2024, driven mainly by increased pentanes plus and propane production.
Figure 8 shows the Alberta supply of crude oil and equivalent in the base case and the total supply in the tariff case.
- Alberta’s production of crude oil and equivalent increased by 5% in 2024, reaching 4.3 106 bbl/d. The increase is primarily driven by nonupgraded bitumen, upgraded bitumen, crude oil, and pentanes plus.
- Under the base case, crude oil and equivalent production is expected to grow throughout the forecast period, reaching 4.7 106 bbl/d by 2034, primarily driven by increased upgraded and nonupgraded bitumen production. Under the tariff case, crude oil and equivalent production is expected to reach 4.7 106 bbl/d by 2034.
- Crude oil production increased to 0.5 106 bbl/d in 2024 and is projected to continue growing until 2027 in the base case. However, from 2028 to 2034, it would gradually decline as new wells placed on production may be insufficient to offset the decline in existing production.
- Under the base case, production of pentanes plus is forecast to grow from 0.4 106 bbl/d in 2024 to 0.5 106 bbl/d by 2034.
Figure 9 shows the percentage of bitumen upgraded in Alberta.
- An estimated 48% of produced raw bitumen was upgraded in Alberta in 2024. By 2034, only about 44% of raw bitumen is projected to be upgraded in Alberta, as the growth in raw bitumen production is expected to outpace upgrading capacity additions.
- Upgraded bitumen output increased by 4.5% in 2024, across all upgraders due to higher utilization.
Figure 10 shows the primary energy demand in Alberta by type in the base case and the total demand in the tariff case.
- Alberta’s total primary energy demand in 2024 was 6146 PJ (2.8 106 BOE/d). Under the base case, Alberta’s demand is projected to increase to about 7007 PJ (3.1 106 BOE/d) by 2034. This increase is attributed to strengthening demand for pentanes plus as a diluent in bitumen blending. Increasing demand for natural gas was driven by power generation and oil sands in situ operations.
- Under the tariff case, Alberta demand is projected to reach 6907 PJ (3.1 106 BOE/d) by 2034, 1% lower than the base case.
- Federal and provincial government policies targeting the reduction of carbon dioxide emissions drove the demand for subbituminous coal in Alberta to nearly zero, as all coal-fired power plants were phased out in 2024.
Figure 11 shows the primary energy removal of energy types from Alberta in the base case and the total removals in the tariff case.
- Primary energy removals from Alberta increased by 3% in 2024. Relatively high prices resulted in increased production output for crude oil, upgraded bitumen, and nonupgraded bitumen. The start-up of the TMX pipeline enabled increased energy removals.
- Total primary energy removals from the province in 2024 were estimated at 11 462 PJ (5.1 106 BOE/d), with oil (bitumen and crude oil) and natural gas liquids representing 84% of the primary energy removals for the year.
- Under the base case, removals from the province are projected to reach 12 614 PJ (5.6 106 BOE/d) by 2034, with bitumen and crude oil representing a growing share of primary energy removals. Under the tariff case, removals are projected to reach 12 391 PJ (5.6 106 BOE/d) by 2034, 2% lower than the base case.
- Under the base case, natural gas removals from Alberta are projected to grow in the short term and decline starting in 2027 and continue to decline to the end of the forecast period. This decline in removals will occur as demand growth is forecast to outpace production growth.
- Removals of marketable bituminous coal from Alberta decreased by 7% in 2024. as production decreased at the Grande Cache, Coal Valley, and Vista coal mines.
Figure 12 shows the removal of oil from Alberta by type in the base case and the total removal in the tariff case.
- In 2024, removals of crude oil, pentanes plus, upgraded bitumen, and nonupgraded bitumen were estimated at 640.5 103 m3/d or 4.0 106 bbl/d—about 4% higher than in 2023.
- Under the base case, by 2034, about 728.1 103 m3/d (4.6 106 bbl/d) of crude oil, pentanes plus, upgraded bitumen, and nonupgraded bitumen are forecast for removal from the province. This projection assumes sufficient removal capacity would be available because of pipeline expansion, optimization, and crude-by-rail transportation. Under the tariff case, total oil removals are projected to reach 717.2 103 m3/d (4.5 106 bbl/d) by 2034, 2% lower than the base case.
Drilling Activity
Figure 13 shows that total drilling increased by 16% in 2024 (natural gas drilling decreased by 10%, crude oil drilling increased by 22%, and oil sands drilling increased by 16%). This is the highest drilling activity over the past sixteen years.
1 Natural gas liquids include ethane, propane, butane, and pentanes plus—on their own or combined—obtained from processing raw gas or condensate.
2 Nontariff measures can include quotas or restrictions on imported goods (i.e., liquor), export taxes on electricity, and changes in consumer and business behaviour (i.e., buying Canadian).
3 Oil and equivalent comprises light, medium, heavy, and ultra-heavy crude oil; upgraded and nonupgraded bitumen (referred to as marketable bitumen); and condensate (pentanes plus).
4 Historical data on oil sands, crude oil, and natural gas investments are from the Canadian Association of Petroleum Producers. Capital expenditures for 2024 are estimates. The 2025-2034 forecasts are produced by the AER.
5 Trends and growth rates may differ slightly when standard units of measure, such as cubic metres or tonnes, are compared. Various grades of energy commodities have different heating values, and any changes to their composition may yield slightly different numerical trends and growth rates.