Updated June 2025
Marketable Natural Gas
Marketable gas is natural gas that remains after raw gas is processed (to remove nonhydrocarbons and heavier natural gas liquids) and meets the specifications for use as a fuel. Marketable natural gas volumes are referred to as either the actual metered volume with the combined heating value of the hydrocarbon components present in the gas (i.e., “as is” gas) or the volume at standard conditions of 37.4 megajoules per cubic metre (MJ/m3). The average heat content of produced natural gas leaving a field plant is estimated to be 39.7 MJ/m3, compared with coalbed methane (CBM) at about 37.0 MJ/m3.
Marketable natural gas production volumes for gas are calculated based on production data from the section on supply and disposition of marketable gas in ST3: Alberta Energy Resource Industries Monthly Statistics.
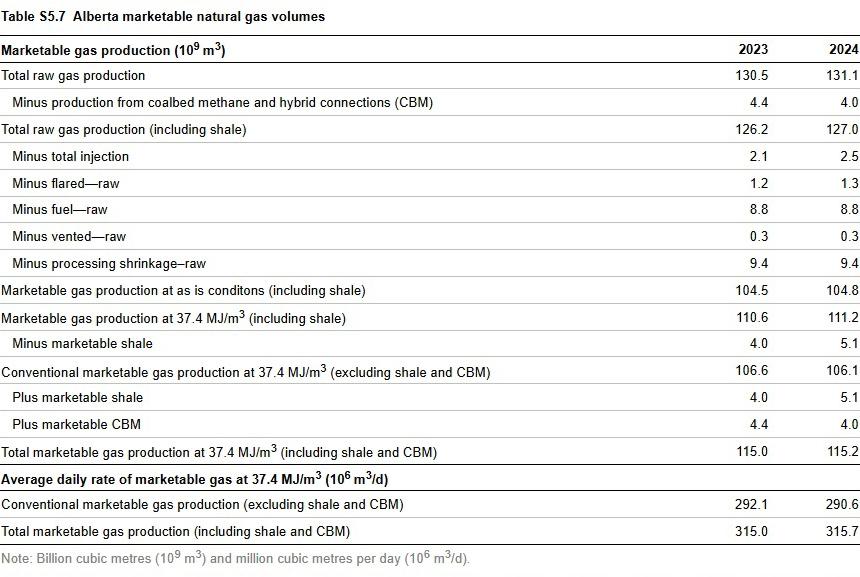
Table S5.7 shows the marketable Alberta natural gas volumes for 2023 and 2024.

Coalbed Methane and Shale Gas
CBM and shale wells are not classified within a specific Petroleum Services Association of Canada (PSAC) area. For this reason, they are presented as a separate category in our estimates. Shale gas and CBM-producing wells are re-evaluated based on new information because historical annual values can change.
Forecasting Natural Gas Production
The AER includes three well-type classifications for natural gas production and gas produced from oil wells:
- CBM: methane found in coal seams as adsorbed or free gas.
- Shale gas: natural gas locked in fine-grained, organic-rich rock.
- Conventional and tight gas: tight gas refers to natural gas found in low-permeability rocks such as sandstone, siltstone, and carbonates.
- Gas from oil wells.
Although tight-gas volumes are included in the AER’s natural gas reserves and production reporting, it is difficult (sometimes impossible) to separate the tight portion of the reserves or production in a conventional reservoir.
Our forecasts for marketable natural gas production consider:
- expected production from existing gas wells,
- expected production from new gas wells placed on production,
- gas production from oil wells, and
- prices, royalties, taxes, capital costs, carbon price, and other costs.
Our forecasts also account for estimates of the remaining established and yet-to-be-established reserves of natural gas in Alberta. We use the Modernized Royalty Framework to estimate royalties.
A net present value is calculated for representative wells for all years of the forecast and forms the basis of the forecast. Limiting factors, such as current and future capital market conditions and remaining reserves, are also considered.
Gas production is forecast separately for conventional and tight, shale, and CBM wells. All projections are combined for a total marketable gas production forecast for Alberta. Continual reclassification of CBM and shale wells placed on production results in revisions to historical data and changes to annual forecasts.
Initial Productivity Rates
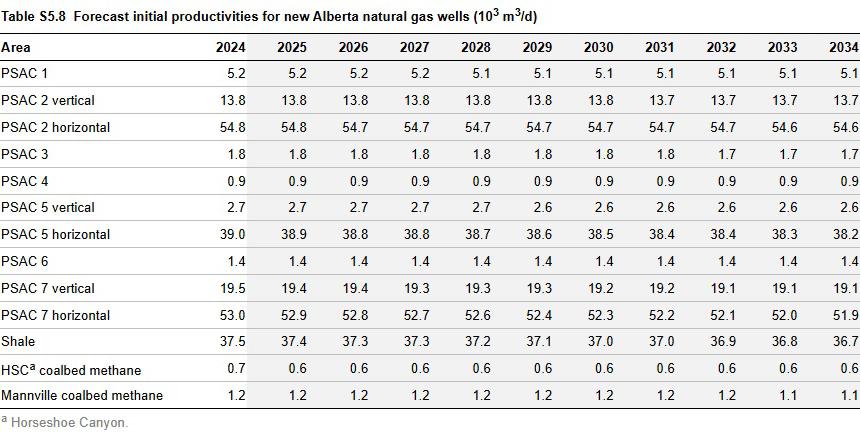
Table S5.8 shows the forecast of initial average productivity for new natural gas (by PSAC area), shale, and CBM wells. These numbers form the basis of the average well productivity over time and are paired with the number of producing wells to forecast production. Initial productivity rates are expected to decline in most areas.

Main Factors in Predicting Volumes
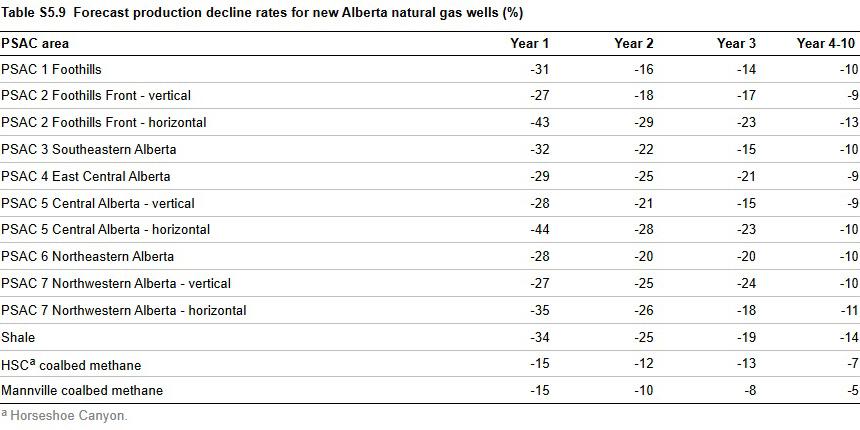
We rely on data from the associated decline rates (Table S5.9) to project natural gas volumes. Decline rates for gas production from gas wells vary depending on a well's age, type, and geological location.

Natural Gas Production Forecast Accuracy
The natural gas production has shown reasonably good accuracy. The forecast deviation from the 2024 actual natural gas production ranged from 6% to 10%. The 2024 natural gas production forecasts from the 2019 and 2021 forecast had the highest deviation of 10% from the actual 2024 natural gas production, due to a combination of uncertainty surrounding the global economic pandemic, geopolitical, and industry-specific factors.
Demand Forecast
The Alberta natural gas demand forecast is based on a sector-by-sector analysis of past, present, and future drivers of natural gas use. For example, demand forecasts for sectors such as oil sands and electricity generation depend on other forecasts, such as crude bitumen production, total electricity demand, and growth in renewable electricity generation.
Natural gas removals are equal to the difference between Alberta's marketable gas production and Alberta's natural gas demand and may include changes to storage. Removals are assumed to satisfy natural gas permitting conditions.
Supply Costs
A supply cost, or “breakeven” price, is the minimum constant dollar price needed for an operator to recover all capital expenditures, operating costs, royalties, and taxes. It is expressed as a dollar value required per unit of production.
The following data were used to derive a supply cost estimate for the average horizontal or vertical/directional well in each PSAC area:
- initial productivity
- production decline rates
- vertical depth
- total measured depth
- gas composition
- shrinkage
- capital costs (drilling, casing, completion, and land acquisition)
- operating costs (processing and transportation)
- royalties
- taxes
- prices of by-products such as natural gas liquids and sulphur
- a 10% nominal rate of return
The supply cost estimates are not risked (i.e., assume a 100% success rate in drilling) and are estimated at plant-gate prices and reported in Canadian dollars. Representative wells in the Foothills, Foothills Front, Central, and Northwestern areas of Alberta (PSAC areas 1, 2, 5, and 7) and the representative wells for shale wells are assumed to produce natural gas liquids as by product.
Data
The AER uses natural gas production volumes submitted by industry to Petrinex. Petrinex is a secure, centralized information network used to exchange petroleum-related information. All 2024 data are as reported by the industry up until the end of December and do not include any subsequent amendments.


