Updated June 2025
Summary
The average daily production of marketable natural gas in 2024 increased marginally to 315.7 million cubic metres per day (106 m3/d) or 11.2 billion cubic feet per day (Bcf/d), the highest production level since 2010. The higher production was driven by increases in gas production concentrated in the Petroleum Services Association of Canada (PSAC) Foothills Front (area 2) and Northwestern Alberta (area 7), shale, and gas from oil wells.
In light of the recent re-evaluation of Alberta’s natural gas reserves, we anticipate the marketable natural gas production to reach 330.1 106 m3/d (11.7 Bcf/d) by 2034 in the base case. Production increases are expected across the Foothills Front, Northwestern Alberta, and shale. These production gains will likely be partially offset by declines from other areas.
Figure S5.1 shows Alberta’s historical average daily marketable gas production and base case forecast by source and PSAC area.
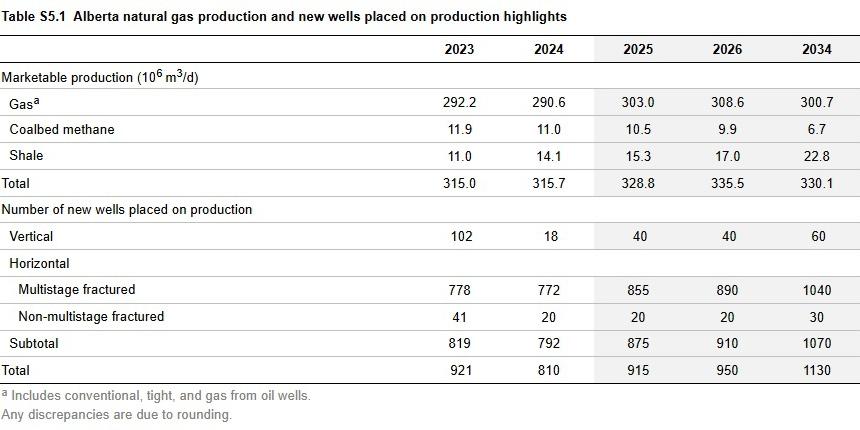
Table S5.1 shows historical numbers and base case forecasts of Alberta’s average daily marketable natural gas production and the number of new wells placed on production by year.
Marketable Gas Production in 2024
Figure S5.2 shows Alberta’s average daily production of marketable gas and the number of new producing wells.
In 2024, the number of horizontal wells placed on production decreased by 3.3% and the number of vertical wells placed on production by 82.4%. Total conventional (including tight) gas production—defined here as gas production excluding coalbed methane (CBM) and shale gas—decreased marginally by 0.5% in 2024. Shale gas production increased by 28.3%, and gas from oil wells increased by 2.0%. CBM production decreased by 7.7% in 2024.
Base Case Forecast for 2025 to 2034
Four trends in natural gas production are expected to continue throughout the forecast period:
- Gas producers will focus on the most productive plays within the province, reducing the need for new wells to maintain production levels compared with past practices.
- Plays rich in natural gas liquids (NGLs) will attract the most attention given their higher profitability, resulting in higher NGL concentrations in the raw gas stream.
- Producers will continue to seek ways to optimize their infrastructure use and lower costs.
- Technological advancements such as drilling horizontal multistage fractured wells will continue to be the prime focus.
Given these trends, most new natural gas wells in Alberta are expected to come online in the Foothills Front, Northwestern Alberta, and Central Alberta PSAC areas. With growth in new wells placed on production, marketable gas production in Alberta is forecast to grow 4.6% by 2034. This production gain, however, is expected to be mildly offset by declines from other PSAC areas.
One-Year Tariff Scenario (Tariff Case)
Under this scenario, the tariffs on the energy sector would reduce natural gas production relative to the base case, as lower regional prices and higher production costs reduce competitiveness. Moreover, these tariffs could lead to a drop in Canadian natural gas exports, particularly to the United States, which can eventually pressure Alberta’s production. Despite tariff-related uncertainty and lower investment in the natural gas sector, the effects on production will be relatively small, partly due to reasonable prices over the medium and long term and upcoming planned or under-construction LNG projects in Canada driven by trade diversification. Marketable gas production is expected to decline by 2.1% in 2025 from the base case and will follow a similar trend as the base case thereafter. Natural gas production is expected to reach 322.3 106 m3/d (11.4 Bcf/d) by 2034, 2.4% lower than the base case.
Figure S5.3 shows the forecast total marketable gas production for the two scenarios.
Oil Sands Gas Production and Use
Oil sands operations produce processed gas and produced gas. Processed gas is a by-product of bitumen upgrading, and its composition varies by process (e.g., coking or hydrocracking). Produced gas is raw natural gas from bitumen wells, and its composition varies depending on the source formation. Production trends for these gas sources are driven by bitumen production and upgrading.
Figure S5.4 shows the average daily gas production from bitumen upgrading and wells in the base case.
Oil sands operators use processed gas and produced gas for fuel and feedstock to generate electricity, steam, hot water for on-site operations, and hydrogen for upgrading units. Processed gas is also sent to processing facilities to extract high-value liquids.
Operators also purchase large quantities of natural gas from external sources—termed “purchased gas”—for use in their operations. Oil sands operations account for over a quarter of the total natural gas consumption in Alberta (excluding gas used for cogeneration).
Figure S5.5 shows Alberta’s total purchased, processed, and produced gas by oil sands operations in the base case.
Oil Sands Gas Use
In 2024
In 2024, the oil sands sector used 111.7 106 m3/d (3.8 Bcf/d) of gas. In mining and upgrading total gas use decreased by 2.5%, whereas gas use for in situ bitumen recovery processes increased by 10.6%.
Forecast for 2025 to 2034
Oil sands gas use is expected to reach 129.1 106 m3/d (4.5 Bcf/d) by 2034, a 15.6% increase from 2024 in the base case. Although total gas use increases align with bitumen production, the bulk of the incremental gas use is gas purchased for in situ bitumen recovery. In situ operations use a high volume of natural gas for steam generation, accounting for most of the bitumen production growth in the forecast.
Purchased Gas
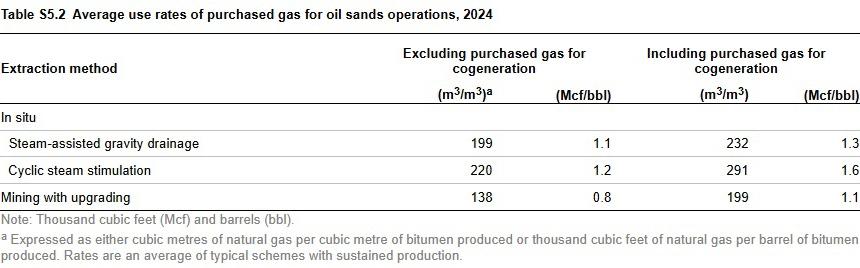
Table S5.2 shows the average use rates of purchased gas for oil sands operations in 2024.