
Sometimes the solution to a problem is right in front of you — it just takes a spark to see it.
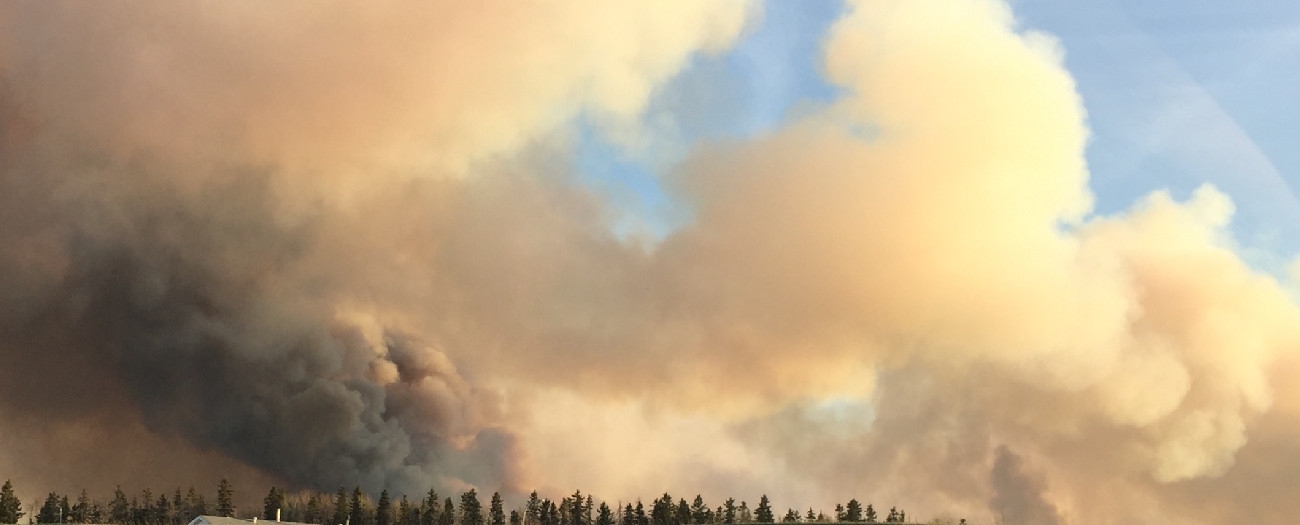
Alberta - August 15, 2016Like most Albertans, Eileen Rubiera was concerned when she heard about the wildfires near Fort McMurray.
Rubiera, a geographic information system (GIS) manager with the AER, knew how difficult it was to map out a natural disaster like a forest fire. In the past, keeping track of the people, buildings, and environmental factors during an emergency often turned into a disaster of its own. There’s just too much information to keep track of at once, and that information is changing every minute. By the time teams had generated a plan of attack, the variables would have changed.
That’s when she had a MacGyver moment: why not apply existing technology to map the danger zone?
When the fires struck this past May, Eileen and her team were putting the finishing touches on the AER’s new reclamation certification tool — an online application using sophisticated interactive maps. The different layers of these maps are generated from GIS, which is industry-standard software designed to capture, store, analyze, and present all types of spatial or geographical data.
In addition to showing specific regions, like cities, protected areas, Indigenous lands, and military bases, the reclamation certification tool shows all the industry assets (facilities, wells, compressor stations, and pipelines) and access roads across Alberta.
“We had maps of the land and all of the oil and gas facilities in the wildfire zone,” said Rubiera. “We knew that if we could add the fire’s environmental information (wind direction and speed, weather conditions, etc.), the AER’s tool would be able to show a complete, real-time view of the fire.”
The AER reached out to other agencies across Alberta, including the Government of Alberta, Environment Canada, Natural Resources Canada, and industry, all of whom were quick to jump on board and provide their specific GIS information for the mapping tool.
The result? Within a day, the AER had designed a one-of-a-kind fire map viewer that could show details on the wildfire’s size and spread; the environmental factors like wind speed, air quality, and weather conditions; and the oil and gas facilities and other critical infrastructure in the Fort McMurray area—all in real-time.
The tool was initially used for response and recovery efforts by a number of different stakeholders, including the Government of Alberta, the Provincial Operations Centre, and the AER’s Emergency Coordination Centre. It was also used by small to mid-sized companies who didn’t have their own GIS capabilities, to help them track their projects and resources in the danger zone.
The tool helped first responders make decisions around evacuations and protection of critical infrastructure. And when the initial dangers had subsided, the mapping tool helped determine re-entry triggers for industry operators.
“There’s a comfort in knowing that the information you’re basing these kinds of decisions on is accurate and up-to-date,” said Rubiera. “There’s no doubt in my mind — these maps made a significant difference in how this fire was fought.”
When not helping to defeat fires, the online map tool gives Albertans access to energy-related maps of the province. Using these maps, people can zoom in on a specific part of Alberta and turn on (or off) different layers to see what’s happening in that area, including all oil and gas assets that include facilities, wells, compressor stations, and pipelines, in addition to sites that have received reclamation certificates from the AER.
Jody Alexander, Writer