
Updated June 2025
Within this section
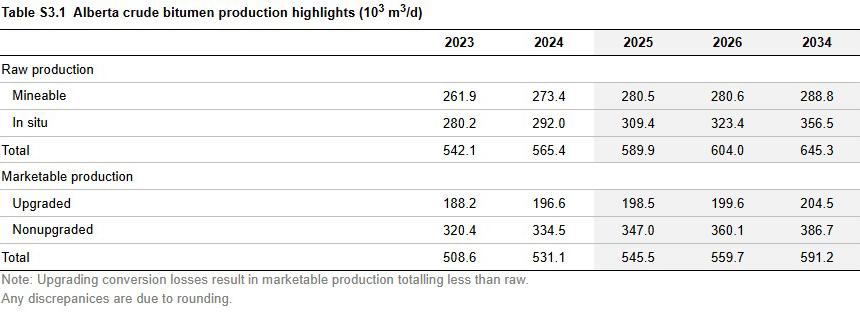
Total Production
Total combined in situ and mined bitumen production increased by 4.3% in 2024 to 565.4 thousand cubic metres per day (103 m3/d) or 3557.8 thousand barrels per day (103 bbl/d) (see the Base Case Table S3.1).
Under the Base Case, growth in production is expected to carry over to 2025 with continued investment focusing on optimizing existing assets and reducing debts. By 2034, total raw bitumen production is forecast to increase to 645.3 103 m3/d (4060.6 103 bbl/d).
The difference between raw and marketable production is that raw bitumen production refers to the total extracted bitumen, which is highly viscous and requires further processing to meet industry standards, while marketable bitumen production is the processed portion, through blending or upgrading, that meets specifications for transport through pipelines.
Total Production by Oil Sands Area
Total bitumen production in the Athabasca oil sands area increased by 4.0% in 2024 to 499.5 103 m3/d or 3143.6 103 bbl/d, accounting for 88% of production in 2024. Under the Base Case, the Athabasca region is expected to drive the forecast in the near and long term. By 2034, the Athabasca region is forecast to produce 578.3 103 m3/d (3639.4 103 bbl/d), accounting for almost 90% of total bitumen production.
Market Conditions
Global market conditions were mixed in 2024. Relatively favourable oil prices, albeit lower, supported growth in oil production and investments. On the other hand, slower global growth led to lower growth in oil demand. Notwithstanding, oil sands production in Alberta continued to grow, supported by various producers’ operational optimization, leveraging the increased takeaway capacity provided by the completion of the Trans Mountain Expansion in the middle of last year.
Emerging Trends
Oil sands producers will continue to find ways to optimize their operations. Large companies with specialized knowledge and ample access to capital can reduce costs, maximize their production capacity, and bring new projects to life with more flexibility.
Many oil sands companies are shifting toward lower-emission projects and recovery technologies—including carbon capture, utilization, and storage—to align with sustainability goals.
Tariff Scenarios
Because of significant uncertainty, particularly regarding U.S. tariff policies, this year’s report examines two scenarios: a short-term tariff uncertainty scenario (base case) and a one-year tariff scenario (tariff case). The primary difference between these scenarios lies in their tariff assumptions.
- Base case: This scenario assumes business as usual and no tariffs. However, the U.S. tariff threats on energy products (oil and gas) persist throughout the first half of 2025 but are ultimately averted through diplomatic negotiations by midyear. Consequently, energy supply and demand are minimally affected.
- Tariff case: This scenario assumes a 10% U.S. tariff on energy products (oil and gas) and 25% tariffs on other Canadian goods imposed in the first half of 2025 despite diplomatic efforts. This scenario includes subsequent U.S. and Canadian retaliatory tariffs, other nontariff measures1, and additional U.S. tariffs on other trading partners. All tariffs and nontariff measures between Canada and the United States persist until the end of the first quarter of 2026 before mostly being phased out as the review or renegotiation of the Canada-United States-Mexico Agreement. It is expected tariffs will have some long-term effects and structural changes to the global economy (changes in trade and investment flows).
These tariff assumptions affect prices, costs, commodity profitability, investment, supply and demand, project risk factors, and commercial start dates (where applicable) for most chapters of the report, including comparisons of the outcomes of these scenarios.
Tariffs on oil and gas exports, along with tariffs to other sectors, are anticipated to remain in place for one year, creating heightened uncertainty, supply chain disruptions, and a broader economic slowdown. Compared to the base case, oil prices are projected to decline while production costs increase, placing downward pressure on profitability and production growth.
Despite these challenges, the overall impact on Alberta’s crude bitumen production is expected to be relatively contained, as exports to the U.S. continue to be demanded mainly driven by many U.S. refineries specifically configured to process bitumen. Production is expected to fall slightly below base case levels under the tariff case, although it will follow a similar trajectory over the forecast period.
In 2025, total bitumen production in the tariff case is expected to be lower by 1.9% from the base case to 578.6 103 m3/d (3640.8 103 bbl/d). With tariffs and its effects persist into the next year, the impact is expected to peak with total bitumen production projected to be 3.4% lower than the base case in 2026, growing to 583.8 103 m3/d (3673.7 103 bbl/d). As the impacts of the tariff will wane, total bitumen production is expected to grow to 633.9 103 m3/d (3989.0 103 bbl/d) in 2034, 1.8% lower than the base case.
Figure S3.2 shows the comparison between the base case and the tariff case.
1 Nontariff measures can include quotas or restrictions on imported goods (i.e., liquor), export taxes on electricity, and changes in consumer and business behaviour (i.e., buying Canadian).